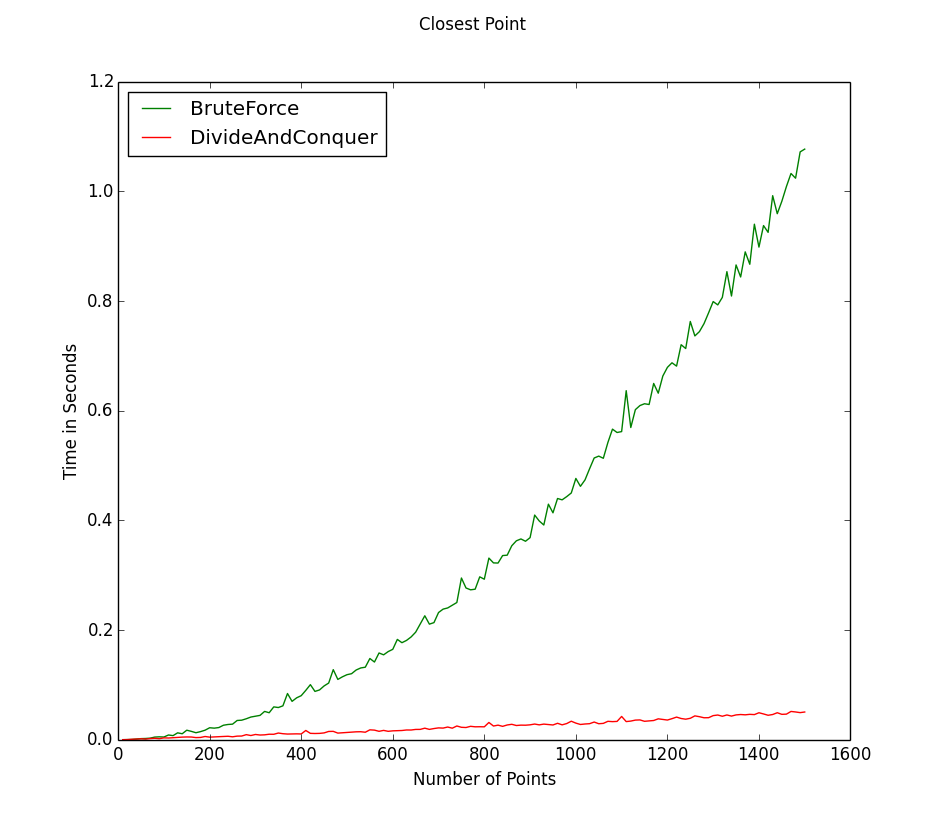
In my algorithms classes I was always disappointed that there was no coding involved. We wrote out lots of pseudo code, but never anything more tangible. I decided to code up some of the algorithms for fun and to solidify the differences between run-times for the algorithms we were working on. This direct comparison helped a lot with my understanding of the algorithms, but the problem I kept having was it was kind of difficult to visualize the results. I wanted something that would let me run my algorithms in whatever language I wanted and just spit out a nice graph of the results. I decided to make a tool to do this and the result is pyGraph.
How it works
PyGraph is a simple script made to easily graph the output of any program in real time. It takes another program as an argument and reads through the output to determine what information to graph. PyGraph uses MatPlotLib from the SciPy toolkit to construct the graphs. The way values are graphed is by prefixing each printed value with “#>” followed by the label on the graph, and then the x and y coordinates. For example:
#>Algorithm1,10,10
#>Algorithm2,12,15
#>Algorithm1,11,11
#>Algorithm2,14,17
This example would create two bars, one called Algorithm1, one called Algorithm2 as well as two points for each algorithm. Any number of labels can be created so I’m not limited to comparing just two algorithms. The title of the graph as well as the x and y axis can be specified in a similar way.
#>Title,Closest Point
#>xAxis,Number of Points
#>yAxis,Time in Seconds
An important note is that this method requires that stdout needs to be flushed every so often otherwise the graph will not update. The examples in the Github repository show how to do this in Python and C++.
Example
One of the problems we covered in my algorithms class is the closest pair of points problem. The goal is given a set of points, find the two points that are closest together. Wikipedia has a great description of this problem as well as an overview of both algorithms I have implemented. The Brute force algorithm has a run-time of O(n^2) while the divide and conquer approach as a run-time of O(n logn).
There are plenty of other uses for this little script other than run-time analysis and the uses should expand as I add new features. Let me know if you are interested in adding anything! Check out pyGraph on Github.

